Balbharati Maharashtra State Board11th Commerce Maths Solution Book PdfChapter 1 Partition Values Ex 1.2 Questions and Answers.
Maharashtra State Board 11th Commerce Maths Solutions Chapter 1 Partition Values Ex 1.2
Solution & Step-by-Step Answer:
The given data can be arranged in ascending order as follows: 36, 38, 51, 63, 64, 68, 70, 72, 79, 82 Here, n = 10 D6 = value of 6 observation = value of 6 observation = value of (6 × 1.1)th observation = value of (6.6)th observation = value of 6th observation + 0.6(value of 7th observation – value of 6th observation) = 68 + 0.6(70 – 68) = 68 + 0.6(2) = 68 + 1.2 ∴ D6 = 69.2 P85 = value of observation = value of observation = value of (85 × 0. 11)th observation = value of (9.35)th observation = value of 9th observation + 0.35(value of 10th observation – value of 9th observation) = 19 + 0.35(82 – 79) = 79 + 0.35(3) = 79 + 1.05 ∴ P85 = 80.05
Solution & Step-by-Step Answer:
The given data can be arranged in ascending order as follows: 180, 200, 210, 225, 230, 250, 250, 300, 350, 350, 375, 375, 380, 400, 450 Here, n = 15 D8 = value of 8 observation = value of 8 observation = value of (8 × 1.6)th observation = value of (12.8)th observation = value of 12th observation – 0.8(value of 13th observation – value of 12th observation) = 375 + 0.8(380 – 375) = 375 + 0.8(5) = 375 + 4 ∴ D8 = 379 P90 = value of 90 observation = value of 90 observation = value of (90 × 0.16)th observation = value of (14.4)th observation = value of 14th observation + 0.4 (value of 15th observation – value of 14th observation) = 400 + 0.4(450 – 400) = 400 + 0.4(50) = 400 + 20 ∴ P90 = 420
Solution & Step-by-Step Answer:
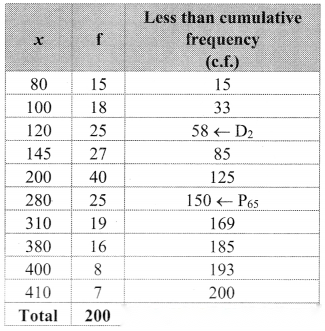
We construct the less than cumulative frequency table as given below: Here, n = 200 D2 = value of 2 observation = value of 2 observation = value of (2 × 20.1)th observation = value of (40.2)th observation Cumulative frequency which is just greater than (or equal to) 40.2 is 58. ∴ D2 = 120 P65 = value of 65 observation = value of 65 observation = value of (65 × 2.01)th observation = value of (130.65)th observation The cumulative frequency which is just greater than (or equal to) 130.65 is 150. ∴ P65 = 280

Solution & Step-by-Step Answer:
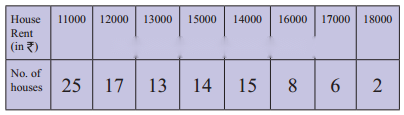
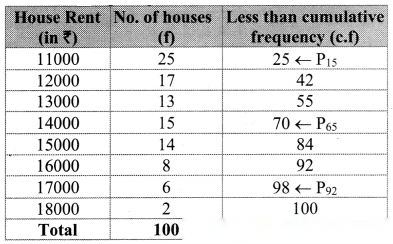
Arranging the given data in ascending order. Here, n = 100 P15 = value of 15 = value of 15 observation = value of 15 observation = value of (15 × 1.01 )th observation = value of (15.15)th observation Cumulative frequency which is just greater than (or equal to) 15.15 is 25. ∴ P15 = 11000 P65 = value of 65observation = value of 65 observation = value of (65 × 1.01)th observation = value of (65.65)th observation Cumulative frequency which is just greater than (or equal to) 65.65 is 70. ∴ P65 = 14000 P92 = value of 92 observation = value of 92 observation = value of (92 × 1.01)th observation = value of (92.92)th observation Cumulative frequency which is just greater than (or equal to) 92.92 is 98. ∴ P92 = 17000
Solution & Step-by-Step Answer:
(a) Let the percentage of students weighing less than 50 kg be x. ∴ Px = 50 From the table, out of 20 students, 84 students have their weight less than 50 kg. ∴ Number of students weighing more than 50 kg = 120 – 84 = 36 ∴ Percentage of students having there weight more than 50 kg = × 100 = 30%


(b) The difference between any two consecutive mid values of weight is 5 kg.
The class intervals must of width 5, with 40, 45,….. as their mid values.
∴ The class intervals will be 37.5 – 42.5, 42.5 – 47.5, etc.
We construct the less than cumulative frequency table as given below:
Here, N = 120
Let Px= 50
The value 50 lies in the class 47.5 – 52.5
∴ L = 47.5, h = 5, f = 29, c.f. = 55
∴ x = 58 (approximately)
∴ 58% of students are having weight below 50 kg.
∴ Percentage of students having weight above 50 kg is 100 – 58 = 42
∴ 42% of students are having weight above 50 kg.


Solution & Step-by-Step Answer:
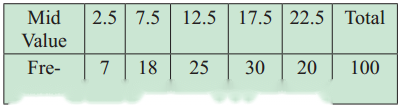
The difference between any two consecutive mid values is 5, the width of class interval = 5 ∴ Class interval with mid-value 2.5 is 0 – 5 Class interval with mid value 7.5 is 5 – 10, etc. We construct the less than cumulative frequency table as given below: Here, N = 100 D4 class = class containing observation ∴ = 40 Cumulative frequency which is just greater than (or equal to) 40 is 50. ∴ D4 lies in the class 10 – 15. ∴ L = 10,h = 5, f = 25, c.f. = 25 ∴ D4 = = 10 + (40 – 25) = 10 + (15) = 10 + 3 ∴ D4 = 13 P48 class = class containing observation ∴ = 48 Cumulative frequency which is just greater than (or equal to) 48 is 50. ∴ P48 lies in the class 10 – 15. ∴ L = 10, h = 5, f = 25, c.f. = 25 ∴ P48 = = 10 + (48 – 25) = 10 + (23) = 10 + 4.6 ∴ P48 = 14.6

Solution & Step-by-Step Answer:
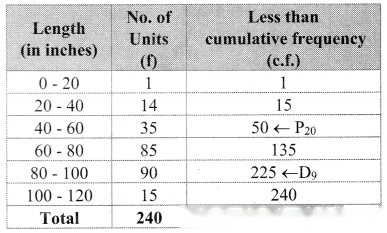
We construct the less than cumulative frequency table as given below: Here, N = 240 D9 class = class containing observation ∴ = 216 Cumulative frequency which is just greater than (or equal to) 216 is 225. ∴ D9 lies in the class 80 – 100. ∴ L = 80, h = 20, f = 90, c.f. = 135 ∴ D9 = = 80 + (216 – 135) = 80 + (81) = 80 + 18 ∴ D9 = 98 P20 class = class containing observation ∴ = 48 Cumulative frequency which is just greater than (or equal to) 48 is 50. ∴ P20 lies in the class 40 – 60. ∴ L = 40, h = 20, f = 35, c.f. = 15 ∴ P20 = 58.86
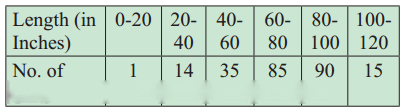

Solution & Step-by-Step Answer:
Let a and b be the missing frequencies of class 500 – 1000 and class 2000 – 2500 respectively. We construct the less than cumulative frequency table as given below: Here, N = 62 + a + b Since, N = 100 ∴ 62 + a + b = 100 ∴ a + b = 38 …..(i) Given, D3 = 1100 ∴ D3 lies in the class 1000 – 1500. ∴ L = 1000, h = 500, f = 25, c.f. = 7 + a ∴ ∴ D3 = ∴ 1100 = 1000 + [30 – (7 + a)] ∴ 1100 – 1000 = 20(30 – 7 – a) ∴ 100 = 20(23 – a) ∴ 100 = 460 – 20a ∴ 20a = 460 – 100 ∴ 20a = 360 ∴ a = 18 Substituting the value of a in equation (i), we get 18 + b = 38 ∴ b = 38 – 18 = 20 ∴ 18 and 20 are the missing frequencies of the class 500 – 1000 and class 2000 – 2500 respectively.


Solution & Step-by-Step Answer:
To find the limits of the profit of the middle 60% of the shops, we have to find P20 and P80. We construct the less than cumulative frequency table as given below: Here, N = 100 P20 class = class containing observation ∴ Cumulative frequency which is just greater than (or equal to) 20 is 26. ∴ P20 lies in the class 1000 – 2000. ∴ L = 1000, h = 1000, f = 16, c.f. = 10 ∴ P20 = = 1000 + (20 – 10) = 1000 + (10) = 1000 + 625 ∴ P20 = 1625 P80 class = class containing observation ∴ Cumulative frequency which is just greater than (or equal to) 80 is 92. ∴ P80 lies in the class 4000 – 5000. ∴ L = 4000, h = 1000, f = 20, c.f. = 72 ∴ P80 = = 4000 + (80 – 72) = 4000 + 50(8) = 4000 + 400 ∴ P80 = 4400 ∴ the profit of middle 60% of the shops lie between the limits ₹ 1,625 to ₹ 4,400.


Solution & Step-by-Step Answer:
Since the given data is not continuous, we have to convert it into a continuous form by subtracting 0.5 from the lower limit and adding 0.5 to the upper limit of every class interval. ∴ the class intervals will be 69.5 – 74.5, 74.5 – 79.5, etc. We construct the less than cumulative frequency table as given below: Here, N = 445 Let Px = 82 The value 82 lies in the class 79.5 – 84.5 ∴ L = 79.5, h = 5, f = 50, c.f. = 85 ∴ 24.72% of workers produced less than 82 output units.


