Balbharati Maharashtra State Board11th Commerce Maths Solution Book PdfChapter 2 Measures of Dispersion Ex 2.1 Questions and Answers.
Maharashtra State Board 11th Commerce Maths Solutions Chapter 2 Measures of Dispersion Ex 2.1
Question 1
Maharashtra Board Solution
Find range of the following data: 575, 609, 335, 280, 729, 544, 852, 427, 967, 250
Solution & Step-by-Step Answer:
Here, largest value (L) = 967, smallest value (S) = 250 ∴ Range = L – S = 967 – 250 = 717
Question 2
Maharashtra Board Solution
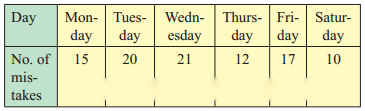
The following data gives the number of typing mistakes done by Radha during a week. Find the range of the data.
Solution & Step-by-Step Answer:
Here, largest value (L) = 21, smallest value (S) = 10 ∴ Range = L – S = 21 – 10 = 11
Question 3
Maharashtra Board Solution
Find range for the following data:
Solution & Step-by-Step Answer:
Here, upper limit of the highest class (L) = 72, lower limit of the lowest class (S) = 62 ∴ Range = L – S = 72 – 62 = 10

Question 4
Maharashtra Board Solution
Find the Q. D. for the following data. 3, 16, 8, 15, 19, 11, 5, 17, 9, 5, 3.
Solution & Step-by-Step Answer:
The given data can be arranged in ascending order as follows: 3, 3, 5, 5, 8, 9, 11, 15, 16, 17, 19 Here, n = 11 Q1 = value of observation = value of observation = value of 3rd observation ∴ Q1 = 5 Q3 = value of 3 observation = value of 3 observation = value of (3 × 3)th observation = value of 9th observation = 16 ∴ Q.D.= = = = 5.5
Question 5
Maharashtra Board Solution
Given below are the prices of shares of a company for the last 10 days. Find Q.D.: 172, 164, 188, 214, 190, 237, 200, 195, 208, 230.
Solution & Step-by-Step Answer:
The given data can be arranged in ascending order as follows: 164, 172, 188, 190, 195, 200, 208, 214, 230, 237 Here, n = 10 Q1 = value of observation = value of observation = value of (2.75)th observation = value of 2nd observation + 0.75(value of 3rd observation – value of 2nd observation) = 172 + 0.75(188 – 172) = 172 + 0.75(16) = 172 + 12 = 184 ∴ Q3 = value of 3 observation = value of 3 observation = value of (3 × 2.75)th observation = value of (8.25)th observation = value of 8th observation + 0.25(value of 9th observation – value of 8th observation) = 214 + 0.25(230 – 214) = 214 + 0.25(16) = 214 + 4 = 218 ∴ Q.D. = = = = 17
Question 6
Maharashtra Board Solution
Calculate Q.D. for the following data.
Solution & Step-by-Step Answer:
Since the given data is arranged in ascending order, we construct less than cumulative frequency table as follows: Here, n = 30 Q1 = value of observation = value of observation = value of (7.75)th observation Cumulative frequency which is just greater than (or equal to) 7.75 is 11. ∴ Q1 = 25 Q3 = value of observation = value of observation = value of (3 × 7.75)th observation = value of (23.25)th observation Cumulative frequency which is just greater than (or equal to) 23.25 is 27. ∴ Q3 = 29 ∴ Q.D. = = ∴ Q.D. = 2


Question 7
Maharashtra Board Solution
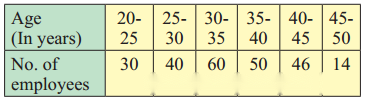
Following data gives the age distribution of 240 employees of a firm. Calculate Q.D. of the distribution.
Solution & Step-by-Step Answer:
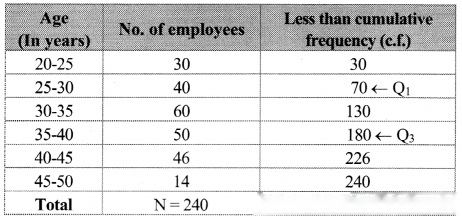
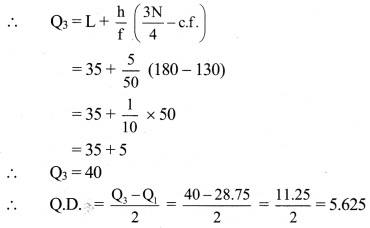
We construct the less than cumulative frequency table as follows: Here, N = 240 Q1 class = class containing observation ∴ = 60 Cumulative frequency which is just greater than (or equal to) 60 is 70. ∴ Q1 lies in the class 25 – 30. ∴ L = 25, c.f. = 30, f = 40, h = 5 Cumulative frequency which is just greater than (or equal to) 180 is 180. ∴ Q3 lies in the class 35-40. ∴ L = 35, c.f. = 130, f = 50, h = 5

Question 8
Maharashtra Board Solution
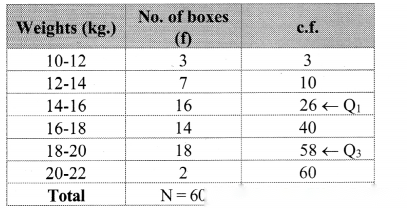
Following data gives the weight of boxes. Calculate Q.D. for the data.
Solution & Step-by-Step Answer:
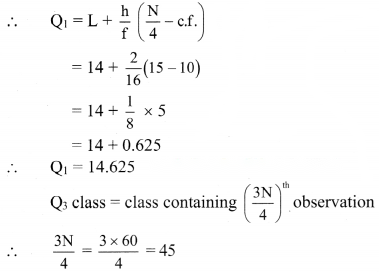
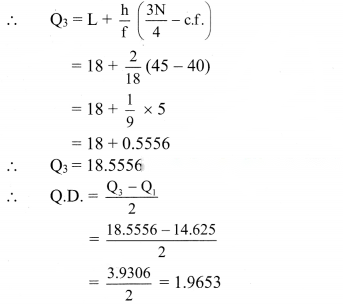
Here, N = 60 Q1 class = class containing observation ∴ = 15 Cumulative frequency which is just greater than (or equal to) 15 is 26. ∴ Q1 lies in the class 14 – 16. ∴ L = 14, c.f. = 10, f = 16, h = 2 Cumulative frequency which is just greater than (or equal to) 45 is 58. ∴ Q3 lies in the class 18 – 20. ∴ L = 18, c.f. = 40, f = 18, h = 2