Balbharati Maharashtra State Board11th Commerce Maths Solution Book PdfChapter 2 Measures of Dispersion Miscellaneous Exercise 2 Questions and Answers.
Maharashtra State Board 11th Commerce Maths Solutions Chapter 2 Measures of Dispersion Miscellaneous Exercise 2
Question 1
Maharashtra Board Solution
Find the range for the following data. 116, 124, 164, 150, 149, 114, 195, 128, 138, 203, 144
Solution & Step-by-Step Answer:
Here, largest value (L) = 203, smallest value (S) = 114 ∴ Range = L – S = 203 – 114 = 89
Question 2
Maharashtra Board Solution
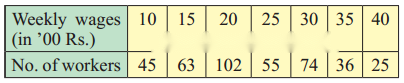
Given below the frequency distribution of weekly w ages of 400 workers. Find the range.
Solution & Step-by-Step Answer:
Here, largest value (L) = 40, smallest value (S) = 10 ∴ Range = L – S = 40 – 10 = 30
Question 3
Maharashtra Board Solution
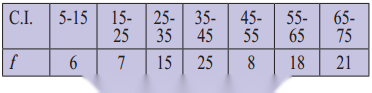
Find the range of the following data.
Solution & Step-by-Step Answer:
Here, upper limit of the highest class (L) = 175, lower limit of the lowest class (S) = 115 ∴ Range = L – S = 175 – 115 = 60

Question 4
Maharashtra Board Solution
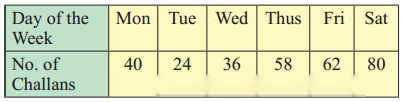
The city traffic police issued challans for not observing the traffic rules: Find Q.D.
Solution & Step-by-Step Answer:
The given data can be arranged in ascending order as follows: 24, 36, 40, 58, 62, 80 Here, n = 6 Q1 = value of observation = value of observation = value of (1.75)th observation = value of 1st observation + 0.75(value of 2nd observation – value of 1st observation) = 24 + 0.75(36 – 24) = 24 + 0.75(12) = 24 + 9 ∴ Q1 = 33 Q3 = value of 3 observation = value of 3 observation = value of (3 × 1.75)th observation = value of (5.25)th observation = value of 5th observation + 0.25(value of 6th observation – value of 5th observation) = 62 + 0.25(80 – 62) = 62 + 0.25(18) = 62 + 4.5 = 66.5 ∴ Q.D. = = 16.75
Question 5
Maharashtra Board Solution
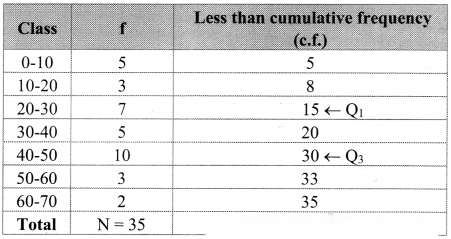
Calculate Q.D. from the following data.
Solution & Step-by-Step Answer:
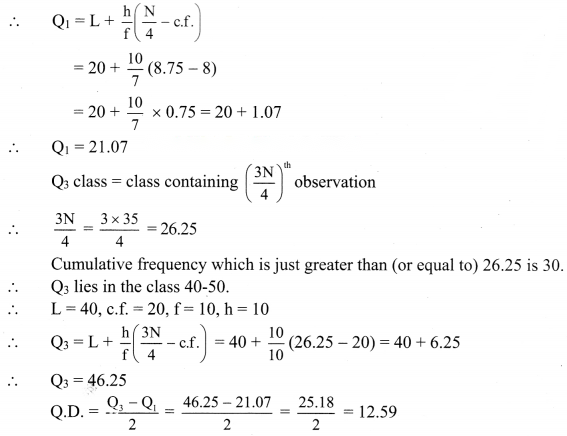
We construct the less than cumulative frequency table as follows: Here, N = 35 Q1 class = class containing observation ∴ = 8.75 Cumulative frequency which is just greater than (or equal to) 8.75 is 15. ∴ Q1 lies in the class 20-30. ∴ L = 20, c.f. = 8, f = 7, h = 10

Question 6
Maharashtra Board Solution
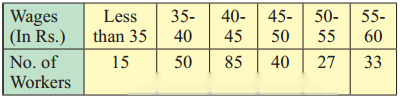
Calculate the appropriate measure of dispersion for the following data.
Solution & Step-by-Step Answer:
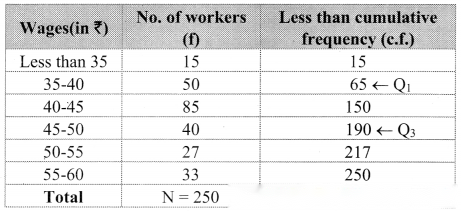
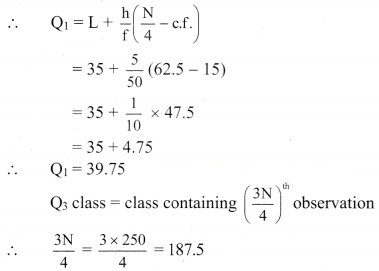
Since open-ended classes are given, the appropriate measure of dispersion that we can compute is the quartile deviation. We construct the less than cumulative frequency table as follows: Here N = 250 Q1 class class containing observation ∴ = 62.5 Cumulative frequency which is just greater than (or equal to) 62.5 is 65. ∴ Q1 lies in the class 35-40. ∴ L = 35, c.f. = 15, f = 50, h = 5 The cumulative frequency which is just greater than (or equal to) 187.5 is 190. ∴ Q3 lies in the class 45-50. ∴ L = 45, c.f. = 150, f = 40, h = 5

Question 7
Maharashtra Board Solution
Calculate Q.D. of the following data.
Solution & Step-by-Step Answer:
We construct the less than cumulative frequency table as follows: Here, N = 120 Q1 class = class containing observation ∴ = 30 Cumulative frequency which is just greater than (or equal to) 30 is 35. ∴ Q1 lies in the class 4-6. ∴ L = 4, c.f. = 15, f = 20, h = 2 Cumulative frequency which is just greater than (or equal to) 90 is 90. ∴ Q3 lies in the class 10-12. ∴ L = 10, c.f. = 72, f = 18, h = 2


Question 8
Maharashtra Board Solution
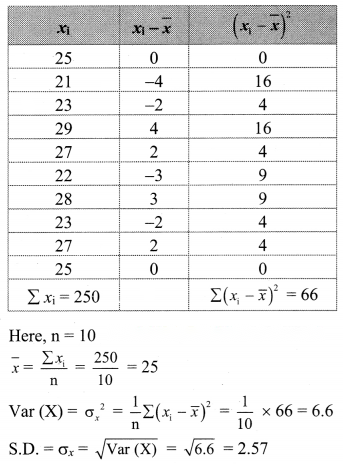
Find variance and S.D. for the following set of numbers. 25, 21, 23, 29, 27, 22, 28, 23, 27, 25 (Given √6.6 = 2.57)
Solution & Step-by-Step Answer:
We prepare the following table for the calculation of variance and S.D.:
Question 9
Maharashtra Board Solution
Following data gives no. of goals scored by a team in 90 matches. Compute the variance and standard deviation for the above data.
Solution & Step-by-Step Answer:
We prepare the following table for the calculation of variance and S.D:


Question 10
Maharashtra Board Solution
Compute the arithmetic mean and S.D. and C.V. (Given √296 = 17.20)
Solution & Step-by-Step Answer:
We prepare the following table for calculation of arithmetic mean and S.D.:


Question 11
Maharashtra Board Solution
The mean and S.D. of 200 items are found to be 60 and 20 respectively. At the time of calculation, two items were wrongly taken as 3 and 67 instead of 13 and 17. Find the correct mean and variance.
Solution & Step-by-Step Answer:
Here, n = 200, = Mean = 60, S.D. = 20 Wrongly taken items are 3 and 67. Correct items are 13 and 17. Now, = 60 Correct value of (sum of wrongly taken items) + (sum of correct items) = 12000 – (3 + 67) + (13 + 17) = 12000 – 70 + 30 = 11960 Correct value of mean = × correct value of = × 11960 = 59.8 Now, S.D. = 20 Variance = (S.D.)2 = 202 ∴ Variance = 400 ∴ Correct value of = – (Sum of squares of wrongly taken items) + (Sum of squares of correct items) = 800000 – (32 + 672) + (132 + 172) = 800000 – (9 + 4489) + (169 + 289) = 800000 – 4498 + 458 = 795960 ∴ Correct value of Variance = ( × ) – (correct value of )2 = × 795960 – (59.8)2 = 3979.8 – 3576.04 = 403.76 ∴ The correct mean is 59.8 and correct variance is 403.76.


Question 12
Maharashtra Board Solution
The mean and S.D. of a group of 48 observations are 40 and 8 respectively. If two more observations 60 and 65 are added to the set, find the mean and S.D. of 50 items.
Solution & Step-by-Step Answer:

Question 13
Maharashtra Board Solution
The mean height of 200 students is 65 inches. The mean heights of boys and girls are 70 inches and 62 inches respectively and the standard deviations are 8 and 10 respectively. Find the number of boys and combined S.D.
Solution & Step-by-Step Answer:
Let n1 and n2 be the number of boys and girls respectively. Let n = 200, = 65, = 70, = 62, σ1 = 8, σ2 = 10 Here, n1 + n2 = n ∴ n1 + n2 = 200 …….(i) Combined mean is given by ∴ 70n1 + 62n2 = 13000 ∴ 35n1 + 31n2 = 6500 ……..(ii) Solving (i) and (ii), we get n1 = 75, n2 = 125 Combined standard deviation is given by,


Question 14
Maharashtra Board Solution
From the following data available for 5 pairs of observations of two variables x and y, obtain the combined S.D. for all 10 observations, where
Solution & Step-by-Step Answer:


Question 15
Maharashtra Board Solution
The mean and standard deviations of two brands of watches are given below: Calculate the coefficient of variation of the two brands and interpret the results.
Solution & Step-by-Step Answer:
Since C.V. (I) > C.V. (II) ∴ the brand I is more variable.


Question 16
Maharashtra Board Solution
Calculate the coefficient of variation for the data given below. [Given √3.3 = 1.8166]
Solution & Step-by-Step Answer: