Balbharati Maharashtra State Board11th Commerce Maths Solution Book PdfChapter 3 Skewness Ex 3.1 Questions and Answers.
Maharashtra State Board 11th Commerce Maths Solutions Chapter 3 Skewness Ex 3.1
Question 1
Maharashtra Board Solution
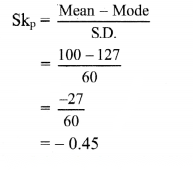
For a distribution, mean = 100, mode = 127 and S.D. = 60. Find the Pearson coefficient of skewness Skp.
Solution & Step-by-Step Answer:
Given, Mean = 100, Mode = 127, S.D. = 60
Question 2
Maharashtra Board Solution
The mean and variance of a distribution are 60 and 100 respectively. Find the mode and the median of the distribution if Skp = -0.3.
Solution & Step-by-Step Answer:
Given, Mean = 60, Variance = 100, Skp = -0.3 ∴ S.D. = √Variance = √100 = 10 Skp = ∴ -0.3 = ∴ -3 = 60 – Mode ∴ Mode = 60 + 3 = 63 Mean – Mode = 3 (Mean – Median) ∴ 60 – 63 = 3(60 – Median) ∴ -3 = 180 – 3Median ∴ 3Median = 180 + 3 = 183 ∴ Median = ∴ Median = 61
Question 3
Maharashtra Board Solution
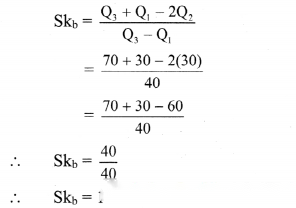
For a data set, sum of upper and lower quartiles is 100, difference between upper and lower quartiles is 40 and the median is 30. Find the coefficient of skewness.
Solution & Step-by-Step Answer:
Given, Q3 + Q1 = 100 ……(i) Q3 – Q1 = 40 …..(ii) Median = Q2 = 30 Adding (i) and (ii), we get 2Q3 = 140 ∴ Q3 = 70 Substituting the value of Q3 in (i), we get 70 + Q1 = 100 ∴ Q1 = 100 – 70 = 30
Question 4
Maharashtra Board Solution
For a data set with an upper quartile equal to 55 and median equal to 42, if the distribution is symmetric, find the value of the lower quartile.
Solution & Step-by-Step Answer:
Upper quartile = Q3 = 55 Median = Q2 = 42 Since, the distribution is symmetric. ∴ Skb = 0 Skb = ∴ 0 = ∴ 0 = Q3 + Q1 – 2Q2 ∴ Q1 = 2Q2 – Q3 ∴ Q1 = 2(42) – 55 ∴ Q1 = 84 – 55 ∴ Q1 = 29
Question 5
Maharashtra Board Solution
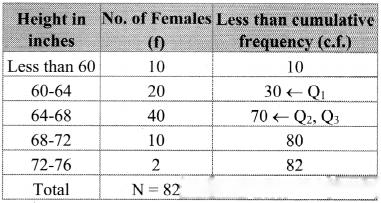
Obtain coefficient of skewness by formula and comment on the nature of the distribution.
Solution & Step-by-Step Answer:
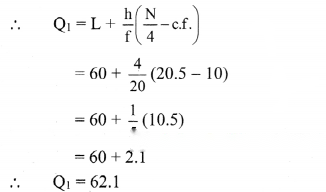
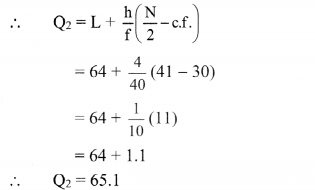
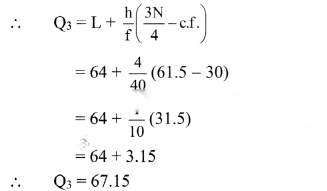
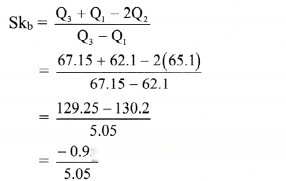
We construct the less than cumulative frequency table as given below. Q1 class = class containing observation ∴ = 20.5 Cumulative frequency which is just greater than (or equal) to 20.5 is 30. ∴ Q1 lies in the class 60 – 64. ∴ L = 60, h = 4, f = 20, c.f. = 10 Q2 class = class containing observation ∴ = 41 Cumulative frequency which is just greater than (or equal) to 41 is 70. ∴ Q2 lies in the class 64 – 68. ∴ L = 64, h = 4, f = 40, c.f. = 30 Q3 class = class containing observation ∴ = 61.5 Cumulative frequency which is just greater than (or equal) to 61.5 is 70. ∴ Q3 lies in the class 64 – 68. ∴ L = 64, h = 4, f = 40, c.f. = 30 ∴ Skb = -0.1881 Since, Skb < 0, the distribution is negatively skewed.

Question 6
Maharashtra Board Solution
Find Skp for the following set of observations. 17, 17, 21, 14, 15, 20, 19, 16, 13, 17, 18
Solution & Step-by-Step Answer:
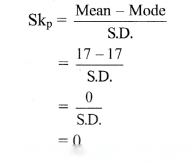
Σxi = 17 + 17 + 21 + 14 + 15 + 20 + 19 + 16 + 13 + 17 + 18 = 187 Mean = = 17 Mode = Observation that occurs most frequently in the data = 17
Question 7
Maharashtra Board Solution
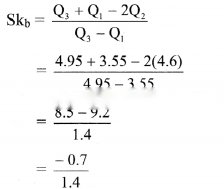
Calculate Skb for the following set of observations of the yield of wheat in kg from 13 plots: 4.6, 3.5, 4.8, 5.1, 4.7, 5.5, 4.7, 3.6, 3.5, 4.2, 3.5, 3.6, 5.2
Solution & Step-by-Step Answer:
The given data can be arranged in ascending order as follows: 3.5, 3.5, 3.5, 3.6, 3.6, 4.2, 4.6, 4.7, 4.7, 4.8, 5.1, 5.2, 5.5 Here, n = 13 Q1 = value of observation = value of observation = value of (3.50)th observation = value of 3rd observation + 0.50(value of 4th observation – value of 3rd observation) = 3.5 + 0.50(3.6 – 3.5) = 3.5 + 0.50(0.1) = 3.5 + 0.05 ∴ Q1 = 3.55 Q2 = value of 2 observation = value of 2 observation = value of (2 × 3.50)th observation = value of 7th observation ∴ Q2 = 4.6 Q3 = value of 3 observation = value of 3 observation = value of (3 × 3.50)th observation = value of (10.50)th observation = value of 10th observation + 0.50 (value of 11th obseration – value of 10th observation) = 4.8 + 0.50(5.1 – 4.8) = 4.8 + 0.50(0.3) ∴ Q3 = 4.95 ∴ Skb = -0.5
Question 8
Maharashtra Board Solution
For a frequency distribution Q3 – Q2 = 90 and Q2 – Q1 = 120. Find Skb.
Solution & Step-by-Step Answer:
Given, Q2 – Q1 = 90, Q2 – Q1 = 120 ∴ Skb = -0.1429
