Balbharati Maharashtra State Board11th Commerce Maths Solution Book PdfChapter 3 Skewness Miscellaneous Exercise 3 Questions and Answers.
Maharashtra State Board 11th Commerce Maths Solutions Chapter 3 Skewness Miscellaneous Exercise 3
Question 1
Maharashtra Board Solution
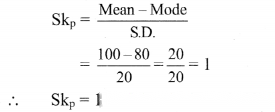
For u distribution, mean = 100, mode = 80 and S.D. = 20. Find Pearsonian coefficient of skewness Skp.
Solution & Step-by-Step Answer:
Given, Mean = 100, Mode = 80, S.D. = 20
Question 2
Maharashtra Board Solution
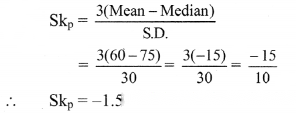
For a distribution, mean = 60, median = 75 and variance = 900. Find Pearsonian coefficient of skewness Skp.
Solution & Step-by-Step Answer:
Given. Mean = 60, Median = 75, Variance = 900 ∴ S.D. = √Variance = √900 = 30
Question 3
Maharashtra Board Solution
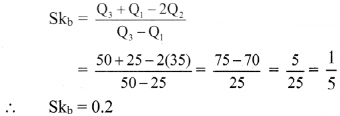
For a distribution, Q1 = 25, Q2 = 35 and Q3 = 50. Find Bowley’s coefficient of skewness Skb.
Solution & Step-by-Step Answer:
Given Q1 = 25, Q2 = 35, Q3 = 50
Question 4
Maharashtra Board Solution
For a distribution Q3 – Q2 = 40, Q2 – Q1 = 60. Find Bowlev’s coefficient of skewness Skb.
Solution & Step-by-Step Answer:
Given, Q3 – Q2 = 40, Q2 – Q1 = 60

Question 5
Maharashtra Board Solution
For a distribution, Bowley’s coefficient of skewness is 0.6. The sum of upper and lower quartiles is 100 and median is 38. Find the upper and lower quartiles.
Solution & Step-by-Step Answer:
Given, Skb = 0.6, Q3 + Q1 = 100, Median = Q2 = 38 Skb = ∴ 0.6 = ∴ 0.6(Q3 – Q1) = 100 – 76 = 24 ∴ Q3 – Q1 = 40 ….(i) Q3 + Q1 = 100 …..(ii) (given) Adding (i) and (ii), we get 2Q3 = 140 ∴ Q3 = 70 Substituting the value of Q3 in (ii), we get 70 + Q1 = 100 ∴ Q1 = 100 – 70 = 30 ∴ upper quartile = 70 and lower quartile = 30
Question 6
Maharashtra Board Solution
For a frequency distribution, the mean is 200, the coefficient of variation is 8% and Karl Pearsonian’s coefficient of skewness is 0.3. Find the mode and median of the distribution.
Solution & Step-by-Step Answer:
Mean = = 200 Coefficient of variation, C.V. = 8%, Skp = 0.3 C.V. = , where σ = standard deviation ∴ 8 = ∴ σ = = 16 Now, Skp = ∴ 0.3 = ∴ 0.3 × 16 = 200 – Mode ∴ Mode = 200 – 4.8 = 195.2 Since, Mean – Mode = 3(Mean – Median) ∴ 200 – 195.2 = 3(200 – Median) ∴ 4.8 = 600 – 3Median ∴ 3Median = 600 – 4.8 = 595.2 ∴ Median = 198.4
Question 7
Maharashtra Board Solution
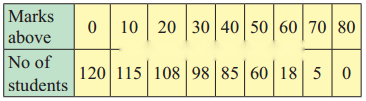
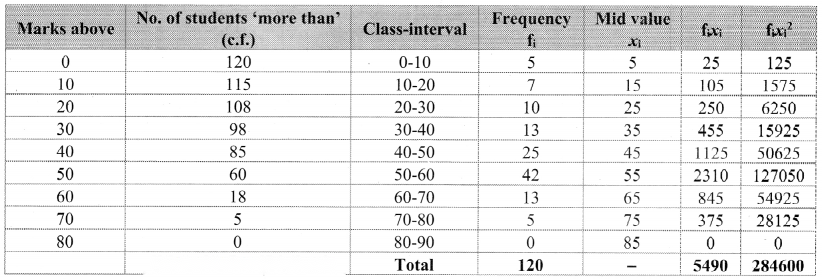
Calculate Karl Pearsonian’s coefficient of skewness Skp from the follow ing data:
Solution & Step-by-Step Answer:
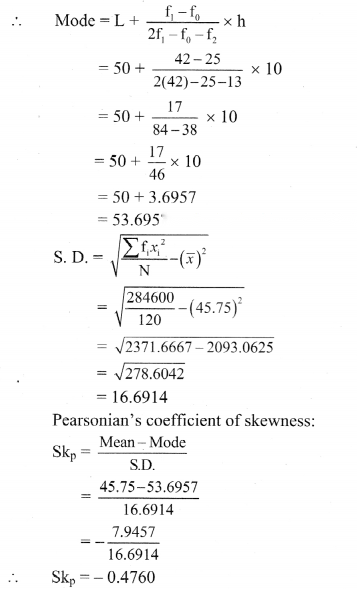
The given table is the cumulative frequency table of more than type. From this table, we have to prepare the frequency distribution table and then calculate the value of Skp. Construct the following table: From the table, N = 120, Σfixi = 5490 and = 284600 Mean = = 45.75 Maximum frequency 42 is of the class 50 – 60 ∴ Mode lies in the class 50 – 60 ∴ L = 50, f1 = 42, f0 = 25, f2 = 13, h = 10
Alternate Method:
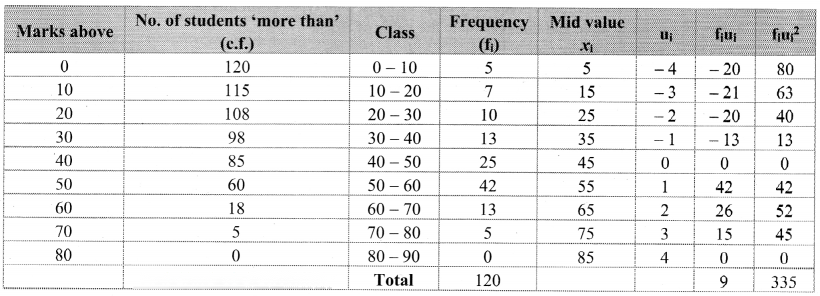
Let u =
= 0.075
∴ = 45 + 10()
= 45 + 10(0.075)
= 45 + 0.75
= 45.75
Var(u) =
= – (0.075)2
= 2.7917 – 0.0056
= 2.7861
Var(X) = h2× Var(u)
= 100 × 2.7861
= 278.61
S.D. = √278.61 = 16.6916
Maximum frequency 42 is of the class 50 – 60.
∴ Mode lies in the class 50 – 60.
∴ L = 50, f1= 42, f0= 25, f2= 13, h = 10

Question 8
Maharashtra Board Solution
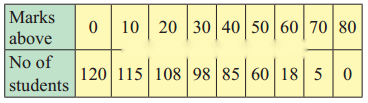
Calculate Bowley’s coefficient of skewness Skb from the following data.
Solution & Step-by-Step Answer:
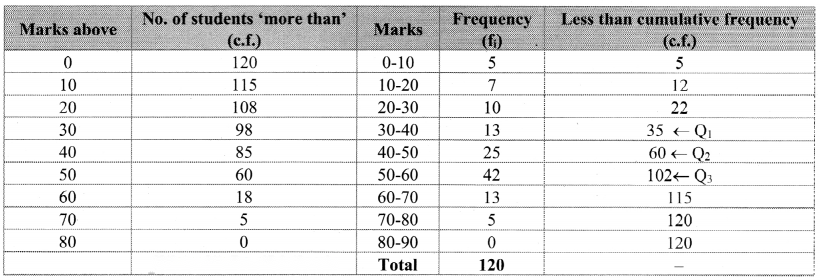
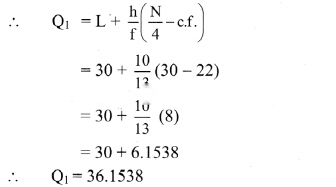
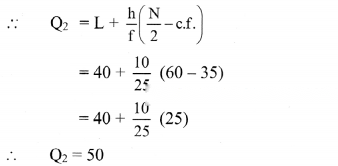
To calculate Bowley’s coefficient of skewness Skb, we construct the following table: Here, N = 120 Q1 class = class containing the observation ∴ = 30 Cumulative frequency which is just greater than (or equal to) 30 is 35. ∴ Q1 lies in the class 30-40. ∴ L = 30, h = 10, f = 13, c.f. = 22 Q2 class = class containing the observation ∴ = 60 Cumulative frequency which is just greater than (or equal to) 60 is 60. ∴ Q2 lies in the class 40-50. ∴ L = 40, h = 10, f = 25, c.f. = 35 Q3 class = class containing the observation ∴ = 90 Cumulative frequency which is just greater than (or equal to) 90 is 102. ∴ Q3 lies in the class 50 – 60 ∴ L = 50, h = 10, f = 42, c.f. = 60

Question 9
Maharashtra Board Solution
Find Skp for the following set of observations: 18, 27, 10, 25, 31, 13, 28
Solution & Step-by-Step Answer:
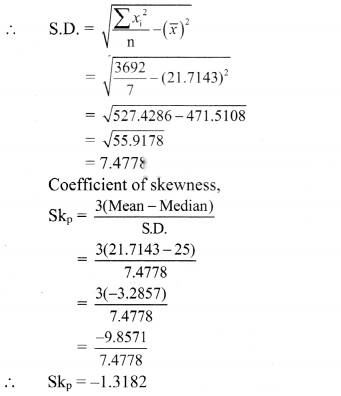
The given data can be arranged in ascending order as follows: 10, 13, 18, 25, 27, 28, 31 Here, n = 7 ∴ Median = value of observation = value of observation = value of 4th observation = 25 For finding standard deviation, we construct the following table:

Question 10
Maharashtra Board Solution
Find Skb for the following set of observations: 18, 27, 10, 25, 31, 13, 28
Solution & Step-by-Step Answer:
The given data can be arranged in ascending order as follows: 10, 13, 18, 25, 27, 28, 31 Here, n = 7 ∴ Q1 = value of observation = value of observation = value of 2nd observation ∴ Q1 = 13 Q2 = value of 2 observation = value of 2 observation = value of (2 × 2)th observation = value of 4th observation ∴ Q2 = 25 Q3 = value of 3 observation = value of 3 observation = value of (3 × 2)th observation = value of 6th observation ∴ Q3 = 28 Coefficient of skewness, ∴ Skb = -0.6
