Maharashtra State Board Class 11 Economics Solutions Chapter 3 Partition Values
1. Choose the correct option:
Solution & Step-by-Step Answer:
(4) None of these
Solution & Step-by-Step Answer:
(1) 7
Solution & Step-by-Step Answer:
(4) a, c and d
2. Identify the correct pairs from the given options:
Options:
(1) 1-b, 2-c, 3-a
(2) 1-c, 2-a, 3-b
(3) 1-c, 2-b, 3-a
(4) 1-a, 2-b, 3-c
Answer:
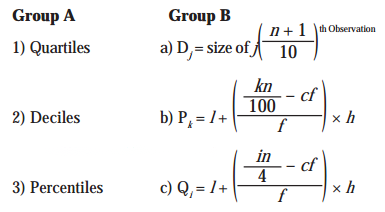
Correct Pair: (2) 1-c, 2-a, 3-b
3. Give economic terms:
Solution & Step-by-Step Answer:
Partitioning
Solution & Step-by-Step Answer:
Deciles
Solution & Step-by-Step Answer:
Quartiles
4. Solve the following:
Solution & Step-by-Step Answer:
Q1 = 9, D4 = 13.6, P26 = 9.16
Solution & Step-by-Step Answer:
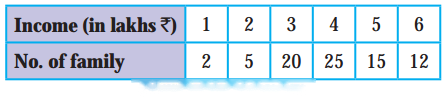
Q3 = ₹ 5 Lakhs, D5 = ₹ 4 Lakhs, P35 = ₹ 4 Lakhs
Solution & Step-by-Step Answer:
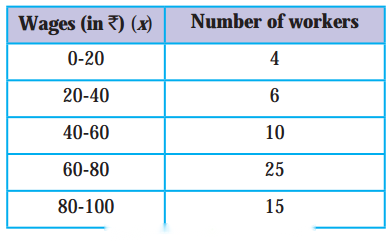
P50 = ₹ 68 Wages
Solution & Step-by-Step Answer:
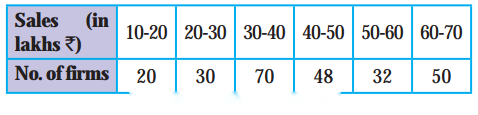
Q3 = ₹ 56.09 Lakhs
Solution & Step-by-Step Answer:
D7 = ₹ 52.1875

Solution & Step-by-Step Answer:
P15 = ₹ 20 lakhs
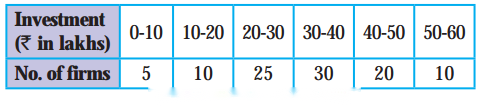
5. State with reasons whether you agree or disagree with the following statements:
Solution & Step-by-Step Answer:
No, I do not agree with the statement.
Solution & Step-by-Step Answer:
Yes, I agree with the statement.
Solution & Step-by-Step Answer:
Yes, I agree with the statement.
6. Answer the following questions on the basis of the given table:

Solution & Step-by-Step Answer:
Q1 = size of Observation Q3 = size of 3 Observation
Solution & Step-by-Step Answer:
Cumulative frequency = 38.
Solution & Step-by-Step Answer:
n = 38
Solution & Step-by-Step Answer:
Median = 30.
11th Economics Digest Chapter 3 Partition Values Intext Questions and Answers
Do you know? (Text Book Page No. 14)
Statistics Day: Prof. Prasanta Chandra Mahalanobis, an Indian Statistician was instrumental in formulating India’s strategy for industrialization in the Second Five Year Plan (1956-61) which later came to be known as Mahalanobis Model.
Mahalanobis devised a measure of comparison between two data sets that are known as the Mahalanobis distance. He also devised a statistical method called ‘fractile graphical analysis’ which could be used to compare the socio-economic conditions of different groups of people. In recognition of the notable contributions made by P. C. Mahalanobis in the field of economic planning and statistical development, the Government of India has designated the 29th of June every year, coinciding with his birth anniversary as ‘Statistics Day’, in the category of Special day to be celebrated at the national level.
Solution & Step-by-Step Answer:
Prof. Prasanta Chandra Mahalanobis, an Indian Statistician formulated India’s strategy for industrialization.
Solution & Step-by-Step Answer:
A measure of comparison between two data sets is called Mahalanobis distance.
Solution & Step-by-Step Answer:
Fractile graphical analysis is a statistical method that can be used to compare the socio-economic; conditions of different groups of people. This method was devised by Prof. P.C. Mahalanobis.
Solution & Step-by-Step Answer:
Statistics Day is celebrated on 29th June every year in recognition of the notable contributions made by Prof. P.C. Mahalanobis in the field of economic planning and statistical development.
Solution & Step-by-Step Answer:
Mahalanobis model is India’s strategy for industrialization in the second five-year plan (1956-61), which was formulated by Prof. P.C. Mahalanobis.