Maharashtra State Board 11th Maths Solutions Chapter 8 Measures of Dispersion Miscellaneous Exercise 8
(I) Select the correct option from the given alternatives:
Question 1
Maharashtra Board Solution
If there are 10 values each equal to 10, then S.D. of these values is _________ (A) 100 (B) 20 (C) 0 (D) 6
Solution & Step-by-Step Answer:
(C) 0 Hint: Var (X) = = – 100 = 0 ∴ S.D. = 0
Question 2
Maharashtra Board Solution
The number of patients who visited cardiologists are 13, 17, 11, 15 in four days, then variance (approximately) is (A) 5 patients (B) 4 patients (C) 10 patients (D) 15 patients
Solution & Step-by-Step Answer:
(A) 5 patients
Question 3
Maharashtra Board Solution
If the observations of a variable X are, -4, -20, -30, -44 and -36, then the value of the range will be: (A) -48 (B) 40 (C) -40 (D) 48
Solution & Step-by-Step Answer:
(B) 40
Question 4
Maharashtra Board Solution
The standard deviation of a distribution divided by the mean of the distribution and expressed in percentage is called: (A) Coefficient of Standard deviation (B) Coefficient of skewness (C) Coefficient of quartile deviation (D) Coefficient of variation
Solution & Step-by-Step Answer:
(D) Coefficient of variation
Question 5
Maharashtra Board Solution
If the S.D. of first n natural numbers is √2, then the value of n must be (A) 5 (B) 4 (C) 7 (D) 6
Solution & Step-by-Step Answer:
(A) 5
Question 6
Maharashtra Board Solution
The positive square root of the mean of the squares of the deviations of observations from their mean is called: (A) Variance (B) Range (C) S.D. (D) C.V.
Solution & Step-by-Step Answer:
(C) S.D.
Question 7
Maharashtra Board Solution
The variance of 19, 21, 23, 25 and 27 is 8. The variance of 14, 16, 18, 20 and 22 is: (A) Greater than 8 (B) 8 (C) Less than 8 (D) 8 – 5 = 3
Solution & Step-by-Step Answer:
(B) 8
Question 8
Maharashtra Board Solution
For any two numbers, SD is always (A) Twice the range (B) Half of the range (C) Square of the range (D) None of these
Solution & Step-by-Step Answer:
(B) Half of the range
Question 9
Maharashtra Board Solution
Given the heights (in cm) of two groups of students: Group A: 131 cm, 150 cm, 147 cm, 138 cm, 144 cm Group B: 139 cm, 148 cm, 132 cm, 151 cm, 140 cm Which of the following is/are true? I. The ranges of the heights of the two groups of students are the same. II. The means of the heights of the two groups of students are the same. (A) I only (B) II only (C) Both I and II (D) None
Solution & Step-by-Step Answer:
(C) Both I and II
Question 10
Maharashtra Board Solution
The standard deviation of data is 12 and mean is 72, then the coefficient of variation is (A) 13.67% (B) 16.67% (C) 14.67% (D) 15.67%
Solution & Step-by-Step Answer:
(B) 16.67%
(II) Answer the following:
Question 1
Maharashtra Board Solution
Find the range for the following data. 76, 57, 80, 103, 61, 63, 89, 96, 105, 72
Solution & Step-by-Step Answer:
Here, largest value (L) = 105, smallest value (S) = 57 ∴ Range = L – S = 105 – 57 = 48
Question 2
Maharashtra Board Solution
Find the range for the following data. 116, 124, 164, 150, 149, 114, 195, 128, 138, 203, 144
Solution & Step-by-Step Answer:
Here, largest value (L) = 203, smallest value (S) = 114 ∴ Range = L – S = 203 – 114 = 89
Question 3
Maharashtra Board Solution
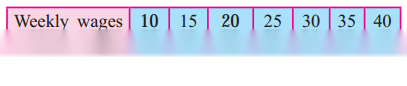
Given below is the frequency distribution of weekly wages of 400 workers. Find the range.
Solution & Step-by-Step Answer:
Here, largest value (L) = 40, smallest value (S) = 10 ∴ Range = L – S = 40 – 10 = 30
Question 4
Maharashtra Board Solution
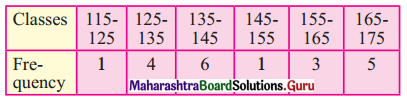
Find the range of the following data.
Solution & Step-by-Step Answer:
Here, upper limit of the highest class (L) = 175 lower limit of the lowest class (S) = 115 ∴ Range = L – S = 175 – 115 = 60
Question 5
Maharashtra Board Solution
Find variance and S.D. for the following set of numbers. 25, 21, 23, 29, 27, 22, 28, 23, 21, 25
Solution & Step-by-Step Answer:
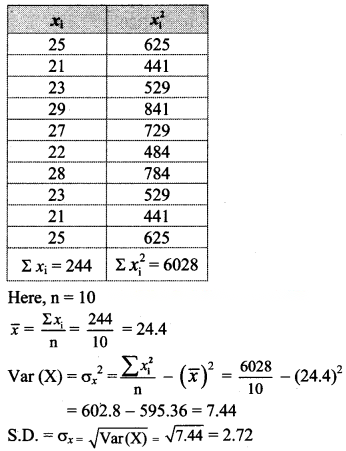
Question 6
Maharashtra Board Solution
Find variance and S.D. for the following set of numbers. 125, 130, 150, 165, 190, 195, 210, 230, 245, 260
Solution & Step-by-Step Answer:
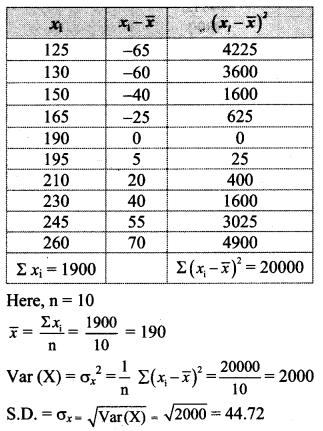
Question 7
Maharashtra Board Solution
Following data gives no. of goals scored by a team in 90 matches. Compute the standard deviation.
Solution & Step-by-Step Answer:


Question 8
Maharashtra Board Solution
Compute the variance and S.D. for the following data:
Solution & Step-by-Step Answer:

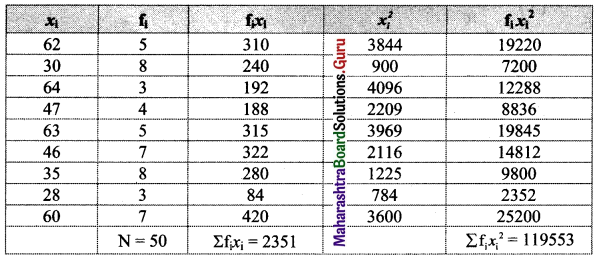
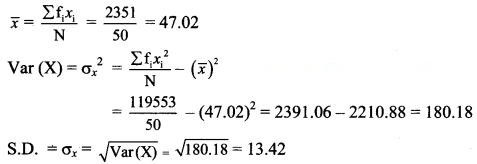
Question 9
Maharashtra Board Solution
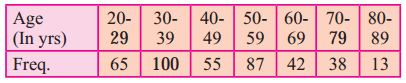
Calculate S.D. from the following data.
Solution & Step-by-Step Answer:
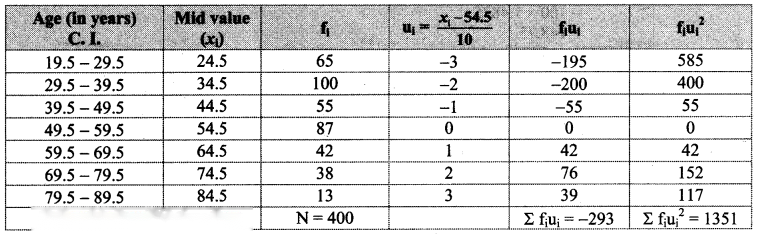
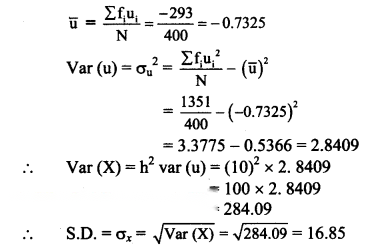
Since data is not continuous, we have to make it continuous. let u = Calculation of variance of u:
Question 10
Maharashtra Board Solution
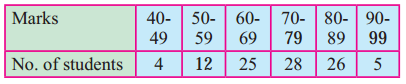
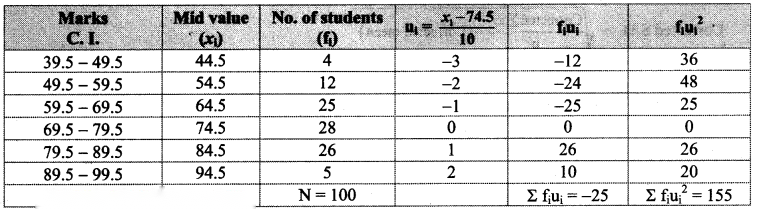
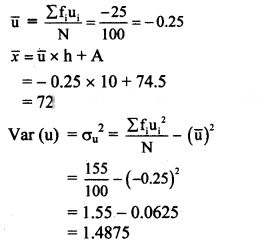
Given below is the frequency distribution of marks obtained by 100 students. Compute arithmetic mean and S.D.
Solution & Step-by-Step Answer:
Since data is not continuous, we have to make it continuous. Let u = Calculation of variance of u: ∴ Var (X) = h2 var (u) = (10)2 × 1.4875 = 100 × 1.4875 = 148.75 ∴ S.D. = σx = √Var(X) = √148.75 = 12.2
Question 11
Maharashtra Board Solution
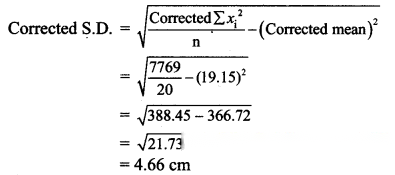
The arithmetic mean and standard deviation of a series of 20 items were calculated by a student as 20 cm and 5 cm respectively. But while calculating them, item 13 was misread as 30. Find the corrected mean and standard deviation.
Solution & Step-by-Step Answer:
n = 20, = 20, σx = 5 …..(given) ∴ = 20 × 20 = 400 Corrected Σxi = Σxi – (incorrect observation) + (correct observation) = 400 – 30 + 13 = 383 Corrected = – (incorrect observation)2 + (correct observation)2 = 8500 – (30)2 + (13)2 = 8500 – 900 + 169 = 7769

Question 12
Maharashtra Board Solution
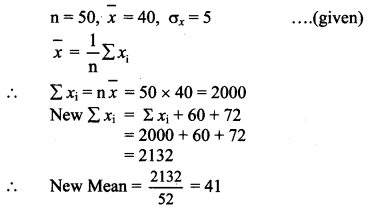
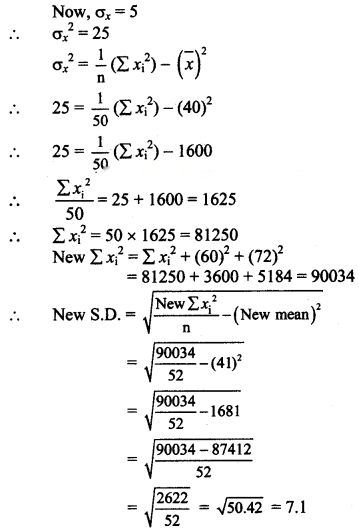
The mean and S.D. of a group of 50 observations are 40 and 5 respectively. If two more observations 60 and 72 are added to the set, find the mean and S.D. of 52 items.
Solution & Step-by-Step Answer:
Question 13
Maharashtra Board Solution
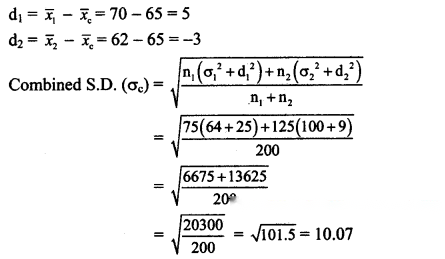
The mean height of 200 students is 65 inches. The mean heights of boys and girls are 70 inches and 62 inches respectively and the standard deviations are 8 and 10 respectively. Find the number of boys and combined S.D.
Solution & Step-by-Step Answer:
Let n1 and n2 be the number of boys and girls respectively. Let n = 200, = 65, = 70, = 62, σ1 = 8, σ2 = 10 Here, n1 + n2 = n n1 + n2 = 200 ……(i) Combined mean () = 65 = …… [From (i)] 70n1 + 62n2 = 13000 35n1 + 31n2 = 6500 …..(ii) Solving (i) and (ii), we get n1 = 75, n2 = 125 Number of boys = 75
Question 14
Maharashtra Board Solution
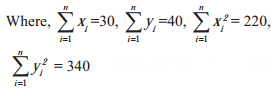
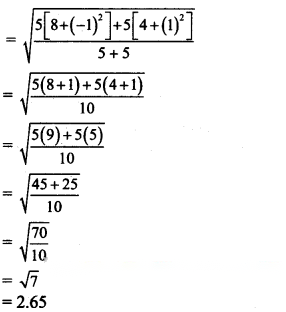
From the following data available for 5 pairs of observations of two variables x and y, obtain combined S.D. for all 10 observations.
Solution & Step-by-Step Answer:

Question 15
Maharashtra Board Solution
Calculate the coefficient of variation of the following data. 23, 27, 25, 28, 21, 14, 16, 12, 18, 16
Solution & Step-by-Step Answer:
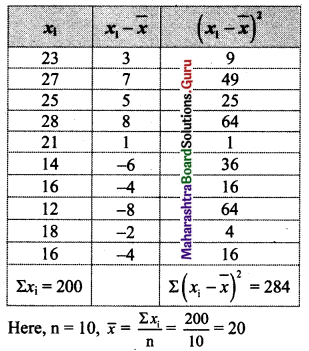
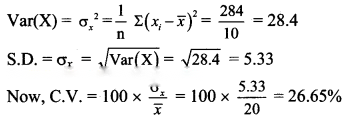
Question 16
Maharashtra Board Solution
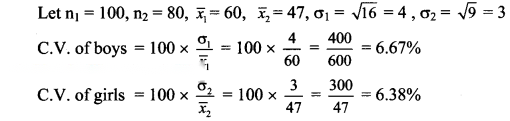
The following data relates to the distribution of weights of 100 boys and 80 girls in a school. Which of the two is more variable?
Solution & Step-by-Step Answer:
Here, C.V. of boys > C.V. of girls ∴ The Series of boys is more variable.

Question 17
Maharashtra Board Solution
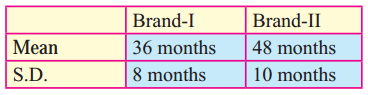
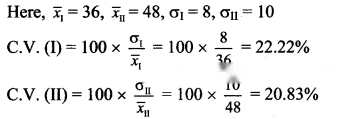
The mean and standard deviations of the two brands of watches are given below: Calculate the coefficient of variation of the two brands and interpret the results.
Solution & Step-by-Step Answer:
Here, C.V. (I) > C.V. (II) ∴ The brand I is more variable.
Question 18
Maharashtra Board Solution
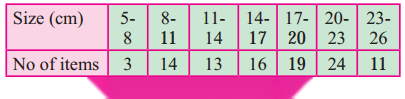
Calculate the coefficient of variation for the data given below:
Solution & Step-by-Step Answer:


Question 19
Maharashtra Board Solution
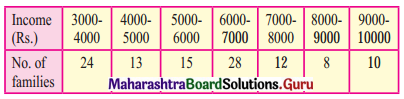
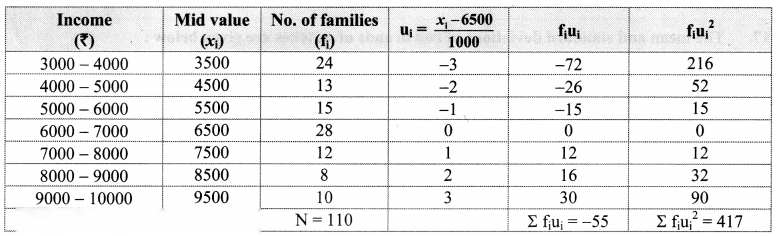
Calculate the coefficient of variation for the data given below:
Solution & Step-by-Step Answer:
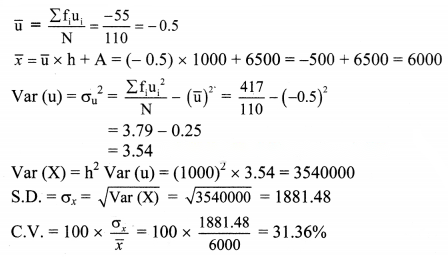
Let u = Calculation of variance of u:
Question 20
Maharashtra Board Solution
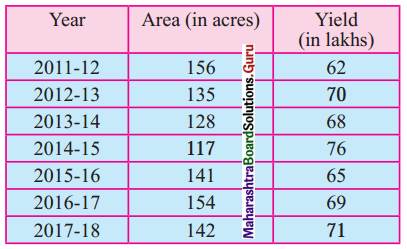
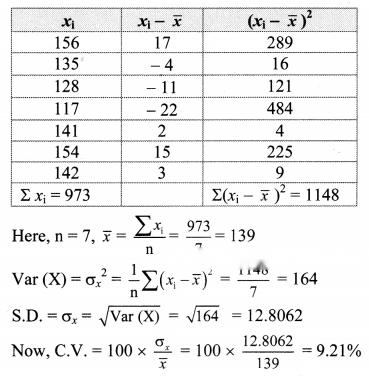
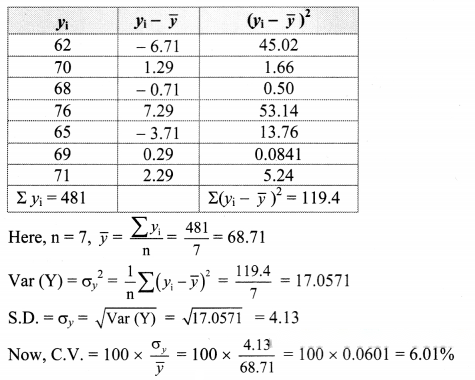
Compute the coefficient of variations for the following data to show whether the variation is greater in the field or in the area of the field.
Solution & Step-by-Step Answer:
∴ the variation is greater in the area of the field.
Question 21
Maharashtra Board Solution
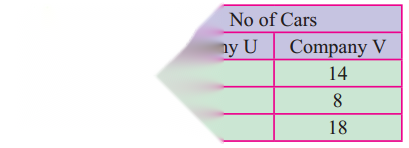
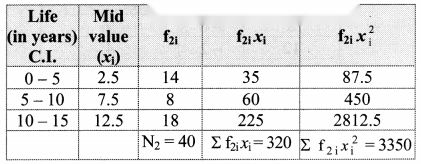
There are two companies U and V which manufacture cars. A sample of 40 cars each from these companies is taken and the average running life (in years) is recorded. Which company shows greater consistency?
Solution & Step-by-Step Answer:
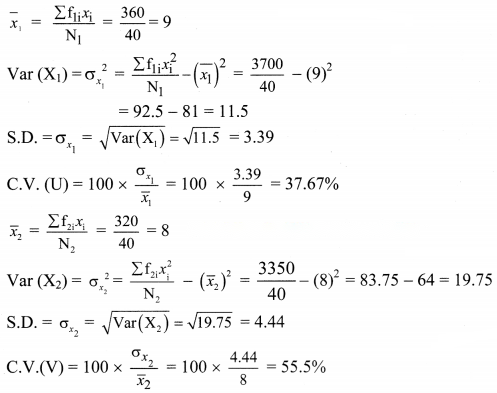
Let f1 denote no. of cars of company U and f2 denote no. of cars of company V. Here, C.V. (U) < C.V. (V) ∴ Company U shows greater consistency in performance.

Question 22
Maharashtra Board Solution
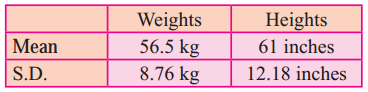
The means and S.D. of weights and heights of 100 students of a school are as follows. Which shows more variability, weights, or heights?
Solution & Step-by-Step Answer:
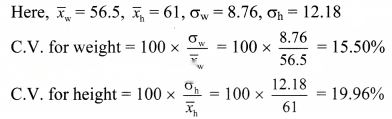
Here, C.V. for weight < C.V. for height ∴ Height shows more variability.