Chapter 7 Population
Textbook Questions and Answers
1. Complete the following sentences:
Question A.
If the birth rate is greater than the death rate then the population …………. .
(i) decreases
(ii) increases
(iii) remains constant
(iv) becomes surplus
Answer:
(ii) increases
Question B.
People of …………… age group are included in the productive population.
(i) 0 to 14
(ii) 14 to 60
(iii) 15 to 60
(iv) 16 to 59
Answer:
(iv) 16 to 59
Question C.
The spread of modern technology in society is mostly dependent on …………….. .
(i) sex ratio
(ii) birth rate
(iii) literacy
(iv) migration
Answer:
(iv) migration
2. Examine the following statements and correct the incorrect ones:
Question a.
The population density of a region can be understood from its area.
Answer:
Incorrect.
Correct sentence: The population density of a region can be understood from its area and the total volume of population living in it.
Question b.
The quality of population is determined on the basis of literacy.
Answer:
Correct.
Question c.
There is an adverse impact on manpower in the regions of out migration.
Answer:
Correct.
Question d.
Greater economic prosperity indicates the development of region.
Answer:
Incorrect.
Correct sentence: Greater economic prosperity as well as higher standards of living, higher quality of life, availability of opportunities, freedom, etc, indicate the development of region.
Question e.
Developing countries have an HDl of 1.
Answer:
Incorrect.
Correct sentence: Developing countries have and HDI of 0.50 to 0.60.
3. Answer in brief.
Question a.
What are the aspects considered in the structure of population?
Answer:
The following are the aspects considered in the structure of the population:
- Sex ratio/structure: Sex ratio/structure is a structure that considers the sub division of population on the basis of gender.
- Age structure: Age structure is a structure that considers the sub division of population as per age groups.
- Occupational structure: Occupational structure is a structure that considers sub division of population on the basis of dependency and workability.
- Rural – urban structure: Rural – Urban structure is a structure that considers sub division of population on the basis of area of residence.
- Literacy structure: Literacy structure is a structure that considers sub division of population on the basis of capability of reading and writing.
Question b.
Prepare a list of advantageous and disadvantageous factors, affecting population distribution.
Answer:
A list of advantageous factors affecting population distribution is as follows:
- Availability of sufficient sunlight, clean air and water.
- Region with low altitude
- Moderate rainfall and temperature
- Fertile soil
- Deposits of minerals
- Industrialisation
- Urbanisation
- Availability of transportation facilities
- Availability of market
- Political stability
- International peace
- Favourable government policies
- Favourable social customs and traditions.
A list of disadvantageous factors affecting population distribution is as follows:
- Shortage of sufficient sunlight, clean air and water.
- Region with high altitude
- Extremely less or more rainfall and temperature
- Infertile soil
- Scarcity of minerals
- Low industrialisation
- Lack of urbanisation
- Non-availability of transportation facilities
- Non-availability of market
- Political instability
- International disputes
- Unfavourable government policies
- Evil social customs and traditions.
Question c.
What are the problems in areas of high population densities?
Answer:
The ratio of the population of a country to its area is population density. While discussing population distribution, density of population is also considered. The density is calculated, as per the formula given below.
Density of population = Population of a region/Area of a region.
The problems in areas of high population densities are as follows:
1. Pollution – Pollution is one of the major reasons which people face due to high population density. Due to an increase in land degradation by making houses and flats, land pollution will be caused, water will be contaminated by a huge number of people, resulting in water pollution and huge number of vehicles will cause air pollution.
2. Overcrowded – The areas with high population density become overcrowded, which bring chaos and lack of peace in the society.
3. Lack of open space – High population density makes it difficult to get a free open space.
Question d.
What arc the problems in area of low population densities?
Answer:
The development of a country depends upon its size of population. A lower population is somehow manageable and resources can be distributed equally. But, sometimes the low population leads to lower demands of goods and services and lower tax revenues for the government to provide goods and services.
4. Give geographical reasons:
Question a.
Population is an important resource.
Answer:
- The economic and cultural development of any country depends upon the volume and the quality of population.
- If a country has a high volume and less quality of population, it has slow economic growth and development.
- If a country has optimum population with high quality of population, it has fast economic growth and development. Thus, population is an important resource.
Question b.
Productive population is an important group.
Answer:
- People belonging to age group of 16 to 59 age are considered as productive. Therefore this population is called productive population.
- People below 16 years of age and above 60 years of age are considered as dependent or non-working population.
- Productive population/people are involved in services or businesses. Therefore they play very important role in economic
- If country has more proportion of productive population and youth, it develops rapidly. Thus, productive population is an important group.
Question c.
The study of age structure is important.
Answer:
1. The study of age structure helps to know the percentage of children, adolescents, youth, middle aged, and old aged in population.
2. The study of age structure helps to know the proportion of productive people (Working people between 16 years to 59 years of age) and unproductive people (Non working people below 16 years of age and above 60 years of age).
3. The study of age structure helps government in planning various economic, social, educational, medical, etc. schemes for the overall development of country.
4. The study of age structure helps to know the speed of economic growth. Thus, the study of age structure is important.
Question d.
Literacy is directly related to development.
Answer:
- The country with high literacy rate, develops rapidly in economic, social and cultural aspects.
- The country with low literacy rate, faces many obstacles in its economic, social and cultural growth and development.
- Literacy rate is related to quality of life, the opportunities available and freedom. Thus, literacy is directly related to development.
Question e.
The real progress of a country is understood with the help of the Human Development Index.
Answer:
1. Human Development Index is calculated by taking into account the values of economic, health and education parameters.
2. Thus, Human Development Index is calculated on the basis of Gross National Product, life expectancy and literacy rate.
3. Human Development Index indicates the standard of living, economic and social welfare, quality of life, opportunities available and freedom. Therefore, the real progress of a country is understood with the help of the Human Development Index.
5. Write notes.
Question a.
Sex ratio.
Answer:
1. The number of females per thousand males is called sex ratio.
2. The sex ratio is calculated with the help of the following formula :

3. If the number of females per thousand males is less, the sex ratio is considered to be low. On the other hand, if the number of females per thousand males is more, the sex ratio is considered to be high.
4. According to Census 2011, the sex ratio was highest (1084) in the state of Kerala. According to Census 2011, the sex ratio was 929 in the state of Maharashtra.
5. Out-migration of males leads to high sex ratio in a region from where males have out-migrated. Less female birth rate leads to low sex ratio.
Question b.
Age structure.
Answer:
- Sub division of population as per age groups is known as age structure.
- Age structure is helpful in knowing the proportion of children, adolescents, young, middle aged and old people in population.
- It is also helpful in knowing proportion of active population (Population between the ages 16 and 59) and dependent population (Population below 16 years of age and above 60 years of age).
- Age structure is helpful to the government in framing various policies.
Question c.
Literacy.
Answer:
1. Population above the age of seven can be sub divided on the basis of capability of reading and writing.
2. People above the age of seven and are unable to read and write are considered illiterate. On the other hand, people above the age of seven and are able to read and write are considered literate.
3. High literacy rate is an indicator of social and economic development of society. On the other hand, high illiteracy rate leads to slow economic, social and cultural development of society.
4. Literacy rate is related to quality of life, the opportunities available and freedom. Thus, it is directly related to development.
Activity:
Question a.
Survey 5 families in your neighbourhood on the basis of the following points and make a presentation.
(a) Sex
(b) Age groups
(c) Education
(d) Occupation
Additional Important Questions and Answers
Fill in the correct word and complete the sentences:
Question A.
……………… state of India has the highest sex ratio.
(i) Maharashtra
(i) Kerala
(c) Punjab
(d) Haryana
Answer:
(b) Kerala
Question B.
………………. district of Maharashtra has low density of population.
(a) Mumbai City
(b) Mumbai Suburb
(c) Thane
(d) Osmanabad
Answer:
(d) Osmanabad
Examine the following statements and correct the incorrect ones:
Question a.
The state of Maharashtra has a balanced population.
Answer:
Incorrect.
Correct sentence: The state of Maharashtra has imbalanced population.
Question b.
The areas with plenty of natural resources normally have more volume of population.
Answer:
Correct.
Question c.
The region with more proportion of youth in population has a rapid speed of development.
Answer:
Correct.
Question d.
Most of people in rural areas are engaged in tertiary activities.
Answer:
Incorrect.
Correct sentence: Most of people in rural areas are engaged in primary activities.
Question e.
Human Development Index is published by World Health Organisation.
Answer:
Incorrect.
Correct sentence: Human Development Index is published by United National Development Programme.
Question f.
Density of population is found to be more in the state of Goa.
Answer:
Correct.
Question g.
The state of Rajasthan is densely populated.
Answer:
Incorrect.
Correct sentence: The state of Rajasthan is sparsely populated.
Answer the following questions in one sentence each:
Question a.
What is birth rate?
Answer:
Birth rate is the number of live births per one thousand people in a year.
Question b.
What is death rate?
Answer:
Death rate is the number of deaths per one thousand people in a year.
Question c.
What is life expectancy?
Answer:
Life expectancy is the expected average life span of an individual at the time j of his/her birth.
Question d.
What is meant by in-migration?
Answer:
Migration of people in a particular region from outside regions is known as in-migration.
Question e.
What is meant by out-migration?
Answer:
Migration of people from a particular region to outside regions is known as out-migration.
Question f.
What is meant by sex ratio?
Answer:
The total number of females per thousand males is known as sex ratio.
Question g.
In which types of occupations are people in urban areas involved?
Answer:
People in urban areas are involved in secondary and tertiary occupations.
Question h.
Who put forth the concept of Human Development Index?
Answer:
Mahbub Ul Haq and Amartya Sen put forth the concept of Human Development Index.
Answer the following questions in brief:
Question a.
Explain the various types of migration.
Answer:
The various types of migration are as follows:
- In-migration: In-migration is migration of people in a particular region from outside regions.
- Out-migration: Out-migration is migration of people from a particular region to outside regions.
- Short term mfgration: Short term migration is migration of people on a i temporary basis. For example, migration due to tourism or natural disaster or education is a short term migration.
- Long term migration: Long term migration is migration of people on a permanent basis. For example, migration due to transfer of service or marriage or war j and partition is a long term migration.
Question b.
Explain the effects of migration.
Answer:
The effects of migration are as follows:
1. Out-migration leads to fall in population of a region from where people have migrated outside. This in turn leads to shortage of manpower in a region from where out-migration has occurred.
2. In-migration leads to increase in population of a region in which people from outside regions have migrated. This in turn, puts a pressure on public amenities and infrastructure of a region in which people have migrated.
3. Migration leads to redistribution of population.
4. Migration also leads to a change in the structure of population in a particular region.
Give geographical reasons:
Question a.
The density of population is found to be high in Mumbai City and Mumbai Suburb district.
Answer:
- Mumbai is economic capital of India.
- In Mumbai City and Mumbai Suburb district, industrialisation and urbanisation has taken place on a large scale.
- Transportation, educational, medical, etc. facilities are available on a large scale in these districts.
- Many employment opportunities are also available in these districts.
Due to all these favourable factors, many people from other districts of Maharashtra as well as from other states of India have migrated to Mumbai on a permanent basis. Therefore, the density of population is found to be high in Mumbai City and Mumbai Suburb district.
Study the following map/figure/graph and answer the following questions:

Study the Figure is given and answer the following questions:
Question a.
Which state has the highest sex\ratio?
Answer:
Kerala state has the highest sex j ratio.
Question b.
Which state has the lowest sex J ratio?
Answer:
Haryana state has the lowest sex ratio.
Question c.
What changes should take place in Maharashtra, to bring about a balanced > sex ratio and how much change is i necessary?
Answer:
The following changes should take place in Maharashtra to bring about a balanced sex ratio:
- Sex ratio must get increased by having total control over female infanticide and launching various government schemes for women empowerment, etc.
- The sex ratio must get increased by 71 i.e. the number of females per thousand males must get increased from 929 to 1000.
Try this:
Question a.
Prepare bar graphs on the basis of the table given below and write a note. (Discuss in group about the issue of literacy in the country.)?

Answer:
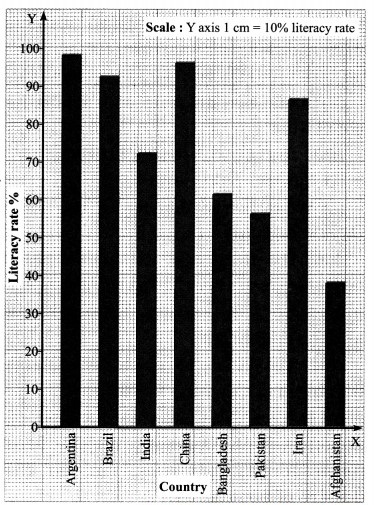
(A) Bar graph:
(B) Note:
- From the above bar diagram it can be seen that the literacy rate is found to be high in developed countries, moderate in developing countries and low in underdeveloped countries.
- In 2010, the literacy rate was 72.1°/e in India.
- In 2010, the literacy rate was 98.1% in Argentina and it was 38.1% in Afghanistan.
- Literacy rate is directly or indirectly related to quality of life, opportunities available and the freedom.
Can you tell?
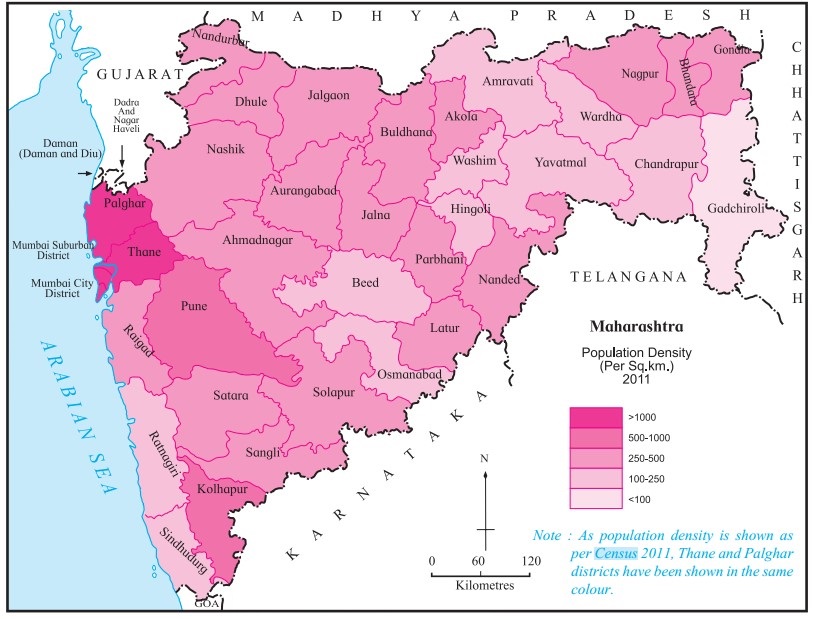
Study Figure is given and answer the following questions:
Question a.
Which are the most densely populated districts?
Answer:
The most densely populated districts are:
- Mumbai City
- Mumbai Suburb
- Thane
- Pune
- Kolha5ur, etc.
Question b.
Name the sparsely populated districts with a density of less than 100 per sq. km.
Answer:
The sparsely populated districts with a density of less than 100 sq. km:
- Gadchiroli
- Beed
- Osmanabad, etc.
Question c.
Name two districts with moderate population.
Answer:
District with moderate population:
- Nashik
- Nagpur.
Question d.
What is the density of the dark shaded regions?
Answer:
The density of the dark shaded regions is greater than 1000 person per sq. km.
Question e.
Why is the density of population less in Gadchiroli?
Answer:
The density of population is less in Gadchiroli due to dense forests.
Question f.
Have a discussion in the class on the effect of physiography, climate, area under forest, industries, etc. on the density of population.
Answer:
1. Physiography: The density of population is found to be high in plain areas. On the other hand, the density of population is found to be low in mountainous regions.
2. Climate: The density of population is found to be high in the areas with moderate temperature and moderate rainfall. On the other hand, the density of population is found to be low in the areas of extremely low or high temperature and extremely high or low rainfall.
3. Area under forest: The density of population is found to be high in the area where forest cover is limited. On the other hand, the density of population is found to be low in the area under dense forests.
4. Industries: The density of population is found to be high in industrially developed region. The density of population is found to be low in industrially backward: region.
Thought-Provoking Questions:
Can you tell?
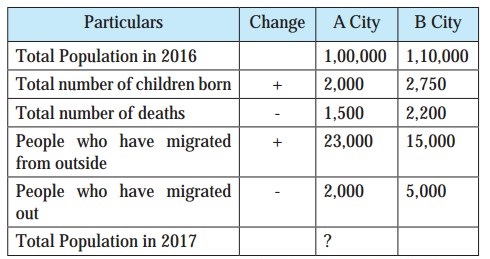
Study the table is given and answer the following questions:
Question a.
Which city has greater number of newly born children?
Answer:
‘B’ City has greater number of newly born children.
Question b.
Which city records greater number of deaths?
Answer:
‘B’ City records greater number of deaths.
Question c.
Looking at the figures of in-migration and out-migration which city has received more migrants?
Answer:
Looking at the figures of in-migration and out-migration, ‘A’ City has received more migrants. .
Question d.
Calculate the population of both the cities in 2017.
Answer:
The population of ‘A’ City in 2017 is 121, 500 and of ‘B’ City in 2017 is 120, 550.
Question e.
After considering all the points, which city has recorded more growth of population in one year?
Answer:
After considering all the points, ‘A’ City has recorded more growth of population in one year. .
Question f.
The total number of births are given. What would be this figure per thousand population? What is the term for this?
Answer:
The total number of births are given. This figure would be 20 per thousand. The term for this is ‘Birth rate’.
Question g.
What would be the number of deaths per thousand population? What is the term used for this?
Answer:
The number of deaths per thousand would be 25. The term used for this is ‘Death rate’.
Complete the following table:
(Note: The answer is given directly.)
Question a.

Answer:
State | Population (2011) | Area (Sq. Km) | Density |
1. Uttar Pradesh | 19,98,12,341 | 2,40,926 | 829.35 |
2. Maharashtra | 11,23,74,333 | 3,07,713 | 356.19 |
3. Tamil Nadu | 7,26,26,809 | 1,30,058 | 558.41 |
4. Rajasthan | 68,54,837 | 3,42,239 | 20.02 |
5. Manipur | 27,21,756 | 22,327 | 121.90 |
6. Goa | 14,58,545 | 3,702 | 393.98 |
Think about it:
Question a.
Even though area wise Rajasthan is a large state, the population is less. Which geographical factors may be responsible for this?
Answer:
The amount of rainfall is comparatively less in the state of Rajasthan. The Thar desert is located in the western part of the state of Rajasthan. Therefore, even though area wise Rajasthan is a large state, the population is less.
Can you tell?
Question a.
Classify Male, Adolescent, Illiterate, Children, Unemployed, Infants, Literate, Rural, Working population, Urban, Female, Old, Young, Dependent population and Adult into the following categories:
- Sex
- Age
- Rural
- Urban
- Literacy
- Productive population.
Answer:
- Sex: Male, Female
- Age: Adolescent, Children, Infants, Old, Young, Adult
- Rural: Rural
- Urban: Urban
- Literacy: Illiterate, Literate
- Productive population: Unemployed, Working population, Dependent population.
Can you tell?

Study the figure and answer the following questions:
Question a.
What do you think are the reasons for the changing land use pattern of Mondha village?
Answer:
Urbanisation and rise in population are the reasons for the changing land use pattern of Mondha village.
Question b.
What kind of changes have taken place?
Answer:
In Mondha village, the agricultural land use has decreased and the non-agricultural land use (i.e. commercial land use, residential land use) has increased.
Question c.
Due to this change in land use, do you think there has been a change in population? If yes, what is the change and why?
Answer:
Due to this change in land use, there has been a change in population. The population of Mondha has increased due to the in-migration.
Can you tell?

Study the table showing percentage of immigrant population of various countries given on page 46 and answer the following questions:
Question a.
Which countries have less than 10% migrant population?
Answer:
Afghanistan, Brazil, Bangladesh, India and Great Britain have less than 10% migrant population.
Question b.
Which are the countries with a migrant population of between 10% and 20%?
Answer:
Germany and U.S.A. are the countries with a migrant population of between 10%
and 20%.
Question c.
Which are the countries with a migrant population of more than 20%
Answer:
Kuwait, Hong Kong, Oman and Saudi Arabia are the countries with a migrant population of more than 20%.
Question d.
Find the reasons behind the migrant population of more than 20%.
Answer:
The reasons behind the migrant population of more than 20% are:
- Huge stock of mineral oil and other natural resources
- Availability of employment opportunities
- Great demand for labour in these countries.
Question c.
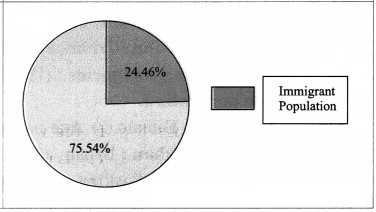
Draw pie diagrams for any two countries.
Answer:
1. Kuwait: A pie diagram showing percentage of immigrant population for Kuwait is as follows:

2. Oman: A pie diagram showing percentage of immigrant population for Oman is as follows:
Question d.
Have a discussion on migration and development.
Answer:
1. Out-migration leads to a shortage of manpower/labour supply. This in turn adversely affects the development of the region from where out-migration has occurred.
2. In-migration leads to increase in population of a region in which in-migration has occurred. This too, adversely affects the development of the respective region.
3. The migration up to certain extent increases the mobility of labourer and it boosts the development of a particular region.
Use your brainpower:
Question a.
In India, 0.52 % of the population are migrants. What is the actual number of people who have migrated to India?
Answer:
According to Census 2011, the population of India was nearly 121 crore. In India, 0. 52 % of the population are migrants. Thus, according to Census 2011, the actual number of people who have migrated to India is nearly 629,200.
Try this:
Question a.
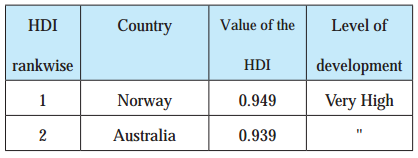
Write a note on the Human Development Index. (HDI) of various countries on the basis of the following table:
HDI Rank wise Country Value of HDI Level of Development

Answer:

- Norway ranks first in the world with respect to Human Development Index (HDI). The value of HDI for Norway is 0.949.
- The countries like Japan, United Kingdom, Denmark, Switzerland, Germany and Australia have the value of Human Development Index (HDI) more than 0.900. These countries show very high level of development.
- The countries like Sri Lanka, Brazil and China have the value of Human Development Index (HDI) between 0.700 and 0.800. These countries show high level of development.
- The countries like India, Bhutan and Pakistan have the value of Human Development Index (HDI) between 0.500 and 0.600. These countries show medium level of development.
- The countries like Niger and Central African Republic have value of Human Development Index (HDI) between 0.300 and 0.400. These countries show less development.
- From the above table it can be seen that Human Development Index (HDI) is an indicator of development.
- Higher value (around 1) of Human Development Index indicates high level of development and lower value (around 0) of Human Development Index indicates low level of development.
Use your brain power:
Question a.
Discuss and write the advantages and disadvantages of low population or high population with reference to the following factors:
(Note: The answer is given directly.)

Answer:
Headings | Low population | High population |
Per capita land availability | Per capita land availability is comparatively more. | Per capita land availability is comparatively less. |
Foodgrains | Food grains are available in plenty. | There is shortage of food grains. |
Resources | Resources are available in plenty. | There is strain on resources. |
Per capita income | Per capita income is comparatively high. | Per capita income is comparatively low. |
Basic amenities and facilities | Basic amenities and facilities are available in sufficient quantity. | There is strain on basic amenities and facilities. |
Percentage of unproductive consumers | Percentage of unproductive consumers is comparatively low. | Percentage of unproductive consumers is comparatively high. |
Planning | Planning is comparatively more effective. | Planning is comparatively less effective. |
Employment | More employment opportunities are available. | Less employment opportunities are available. |
Urbanisation | The rate of urbanisation may be comparatively low. | The rate of urbanisation may be comparatively high. |
Health | The quality of health may be comparatively high. | The quality of health may be comparatively low. |
Higher education | The number of highly qualified people may be comparatively more. | The number of highly qualified people may be comparatively low. |
Social environment | Social environment may be comparatively supportive and favourable. | Social environment may be comparatively adverse and unfavourable. |
Give it a try:

Question a.
Since the past two centuries, the size of family is decreasing. But inspite of this the population of the country is increasing. Find out why is this happening.
Answer:
1. Since the past two centuries, the death rate in India has reduced to a great extent. On the other hand, since the past two centuries, the birth rate in India has reduced negligibly. Therefore, since the past two centuries, the size of family is decreasing. But in spite of this the population of country is increasing.
Use your brain power:
Question a.
As per the population Census of 2011, the population of India is 121 crores. For domestic use, the per capita requirement per day is 50 litres of water. Taking this into account, what would be the total amount of water requirement in India for domestic purpose only.
Answer:
- As per the Population Census of 2011, the population of India is. 121 crores?
- For domestic use, the per capita requirement per day is 50 litres of water.
- Taking this into account, the total amount of water requirement in India for domestic purpose only, will be nearly 6050 crores litre.
Open-Ended Questions:
Question a.
What are the problems in areas of high population distribution?
Answer:
The following are the problems in areas of high population distribution:
- Increased level of water, air, sound and soil pollution.
- Traffic jam
- Shortage of residential areas
- Increased criminal tendencies, etc.
Question b.
What are the problems in areas of low population densities?
Answer:
The following are the problems in areas of low population densities:
- Shortage of labour supply
- Low levels of demand for various goods and services
- Under utilization of resources, etc.
Give it a try:
Question a.
How do imbalanced sex ratios affect the society?
Answer:
Imbalanced sex ratios affect the society as follows:
- Increased problems in society, workplace, etc.
- Increased crimes against women.
Question b.
What measures can be taken to strike a balance in the sex ratio?
Answer:
The following measures can be taken to strike a balance in the sex ratio:
- Increasing literacy rate of females.
- Increasing employment opportunities for women.
- Eradicating evil social customs.
- Launching government schemes of women empowerment.