Chapter 11 Statistics Set 11.3
Question 1.
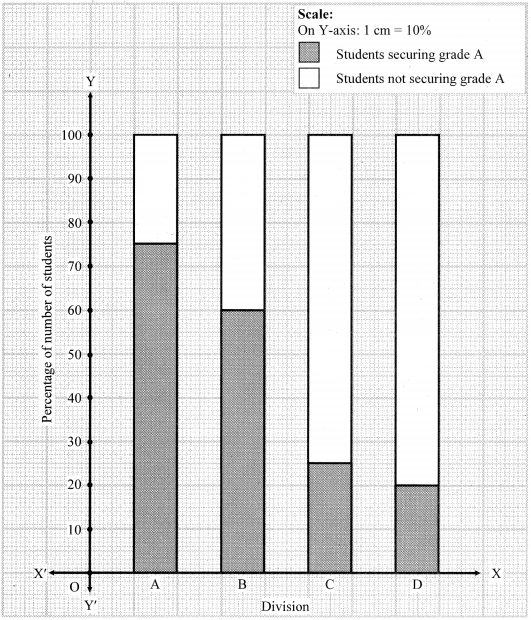
Show the following information by a percentage bar graph.
Division of standard 8 | A | B | C | D |
Number of students securing grade A | 45 | 33 | 10 | 15 |
Total number of students | 60 | 55 | 40 | 75 |
Solution:
Division of standard 8 | A | B | C | D |
Number of students securing grade A | 45 | 33 | 10 | 15 |
Total number of students | 60 | 55 | 40 | 75 |
Percentage of students securing grade A | 75% | 60% | 25% | 20% |
Percentage of students not securing grade A | 25% | 40% | 75% | 80% |
Question 2.
Observe the following graph and answer the questions.
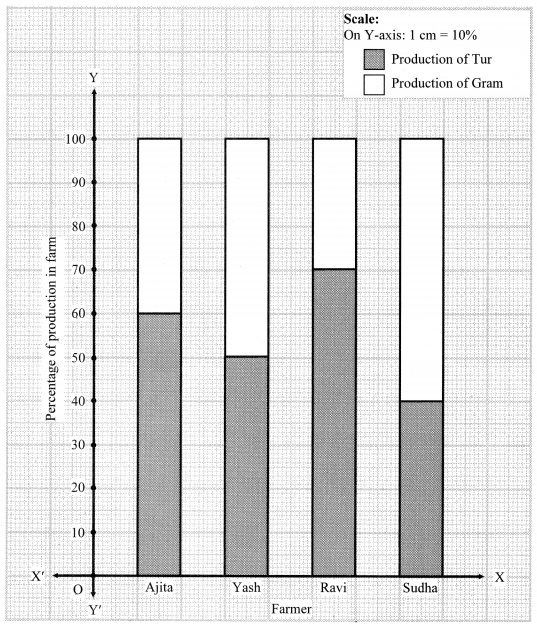
- State the type of the bar graph.
- How much percent is the Tur production to total production in Ajita’s farm?
- Compare the production of Gram in the farms of Yash and Ravi and state whose percentage of production is more and by how much?
- Whose percentage production of Tur is the least?
- State production percentages of Tur and Gram in Sudha’s farm.
Solution:
- The given graph is a percentage bar graph.
- Percent of tur production to the total production in Ajita’s farm is 60%.
-
Production of Gram in the farm of Yash = 50%
Production of Gram in the farm of Ravi = 30%
∴ Difference in the production = 50% – 30% =20%
∴ Yash’s production of Gram is more and by 20%. - Sudha’s percentage production of Tur is the least.
- Production percentages of Tur and Gram in Sudha’s farm are 40% and 60% respectively.
Question 3.
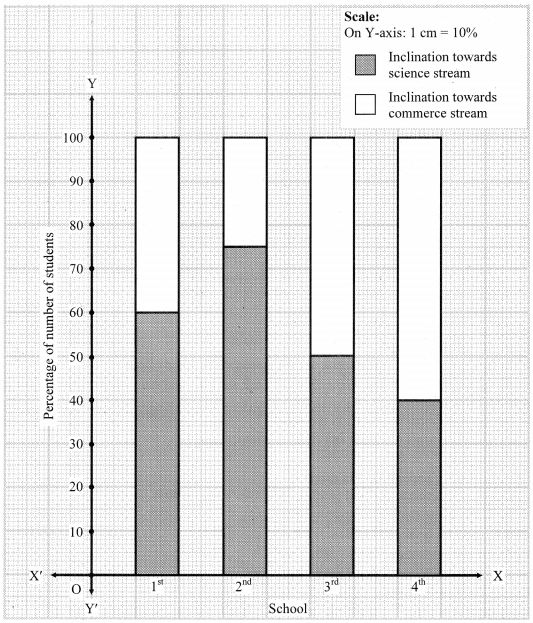
The following data is collected in a survey of some students of 10th standard from some schools. Draw the percentage bar graph of the data.
School | 1st | 2nd | 3rd | 4th |
Inclination towards science stream | 90 | 60 | 25 | 16 |
Inclination towards commerce stream | 60 | 20 | 25 | 24 |
Solution:
School | 1st | 2nd | 3rd | 4th |
Inclination towards science stream | 90 | 60 | 25 | 16 |
Inclination towards commerce stream | 60 | 20 | 25 | 24 |
Total number of students | 150 | 80 | 50 | 40 |
Percentage of students having inclination towards science stream | 60% | 75% | 50% | 40% |
Percentage of students having inclination towards commerce stream | 40% | 25% | 50% | 60% |
Intext Questions and Activities
Question 1.
Compare and discuss a percentage bar diagram and a subdivided bar diagram. Use it to learn the graphs in the subjects like Science, Geography. (Textbook pg, no. 74)
Solution:
[Students should attempt the above activity on their own.]