Chapter 6 Statistics Set 6.3
Chapter 6 Statistics Set 6.3
Question 1.
The following table shows the information regarding the milk collected from farmers on a milk collection centre and the content of fat in the milk, measured by a lactometer. Find the mode of fat content.
Solution:
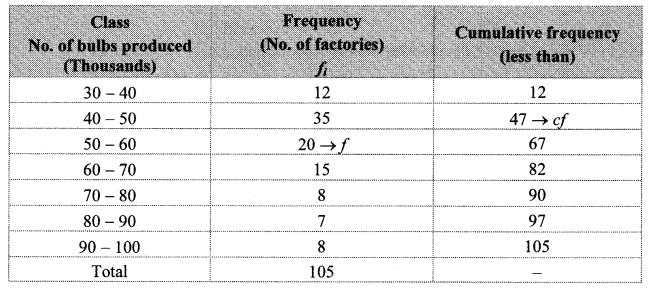
Here, the maximum frequency is 80.
∴ The modal class is 4 – 5.
L = lower class limit of the modal class = 4
h = class interval of the modal class = 1
f1 = frequency of the modal class = 80
f0 = frequency of the class preceding the modal class = 70
f2 = frequency of the class succeeding the modal class = 60
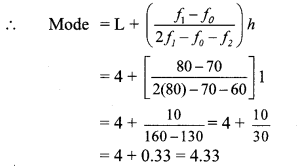
∴ The mode of the fat content is 4.33%.
Question 2.
Electricity used by some families is shown in the following table. Find the mode of use of electricity.
Solution:
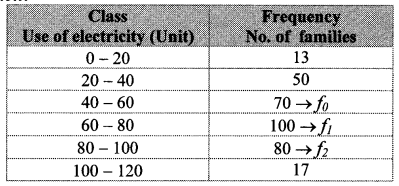
Here, the maximum frequency is 100.
∴ The modal class is 60 – 80.
L = lower class limit of the modal class = 60
h = class interval of the modal class = 20
f1 = frequency of the modal class = 100
f0 = frequency of the class preceding the modal class = 70
f2 = frequency of the class succeeding the modal class = 80

∴ The mode of use of electricity is 72 units.
Question 3.
Grouped frequency distribution of supply of milk to hotels and the number of hotels is given in the following table. Find the mode of the supply of milk.
Solution:
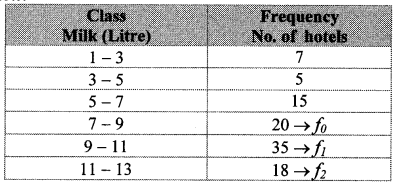
Here, the maximum frequency is 35.
∴ The modal class is 9 – 11.
L = lower class limit of the modal class = 9
h = class interval of the modal class = 2
f1 = frequency of the modal class = 35
f0 = frequency of the class preceding the modal class = 20
f2 = frequency of the class succeeding the modal class = 18
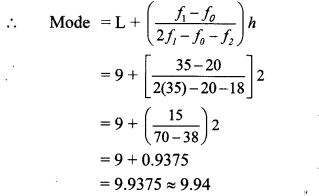
∴ The mode of the supply of milk is 9.94 litres (approx.).
Question 4.
The following frequency distribution table gives the ages of 200 patients treated in a hospital in a week. Find the mode of ages of the patients.
Solution:

Here, the maximum frequency is 50.
The modal class is 9.5 – 14.5.
L = lower class limit of the modal class = 9.5
h = class interval of the modal class = 5
f1 = frequency of the modal class = 50
f0 = frequency of the class preceding the modal class = 32
f2 = frequency of the class succeeding the modal class = 36
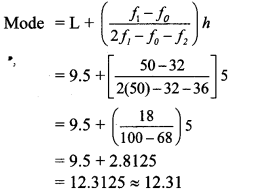
∴ The mode of the ages of the patients is 12.31 years (approx.).